Radar Tomography Explained: A Multilayered Process for a Multilayered Underground
Radar Tomography Explained: A Multilayered Process for a Multilayered Underground
Between Google Maps and Google Earth, there are not many structures above the ground that aren’t captured, accounted for, and named for all the public to see. So why isn’t this true for what’s below the surface?
In our industry, underground accidents occur more often than they should and usually can be traced back to the unknowns of the underground. The 2019 DIRT report from the Common Ground Alliance estimated an all-time high of underground utility damage for that year at 532,000 events, costing the industry $30 billion. The top cause of these events? Failure to properly locate underground assets and contact 811.
Imagine if we could locate everything underground, know exactly what the assets are, and account for them in records that can be shared across the industry, just like Google Maps and Google Earth. Well, thanks to radar tomography, we can come closer than ever before to achieving this goal.
In our last blog post, we explained radar tomography — a GPR-driven remote sensing method for data acquisition — and how it’s used in subsurface utility mapping work. The intent is to enable asset owners, designers, and constructors to capture and subsequently visualize what’s underground, in precise detail. In this post, we focus more specifically on how radar tomography methods, including data acquisition and analysis, enable such precise, detailed information on underground assets. It all boils down to one thing: content.
Why Bother with Radar Tomography?
Many parts of the world have been built up in unstructured, unplanned, dynamic ways, in many cases resulting in urban sprawl. To maintain growth and population expansion in all urban areas, government and state agencies, city planners, and decision makers need a plan for building new facilities while continuing to maintain the existing infrastructure, much of which has long outlived its intended design life. Hence, the need for better content in our plans.
We all know that the best content of any kind — a report, an article, even a speech — starts with the right information. Remote sensing technologies such as radar tomography are not new, but like any other technology, they have morphed into a higher form over time.
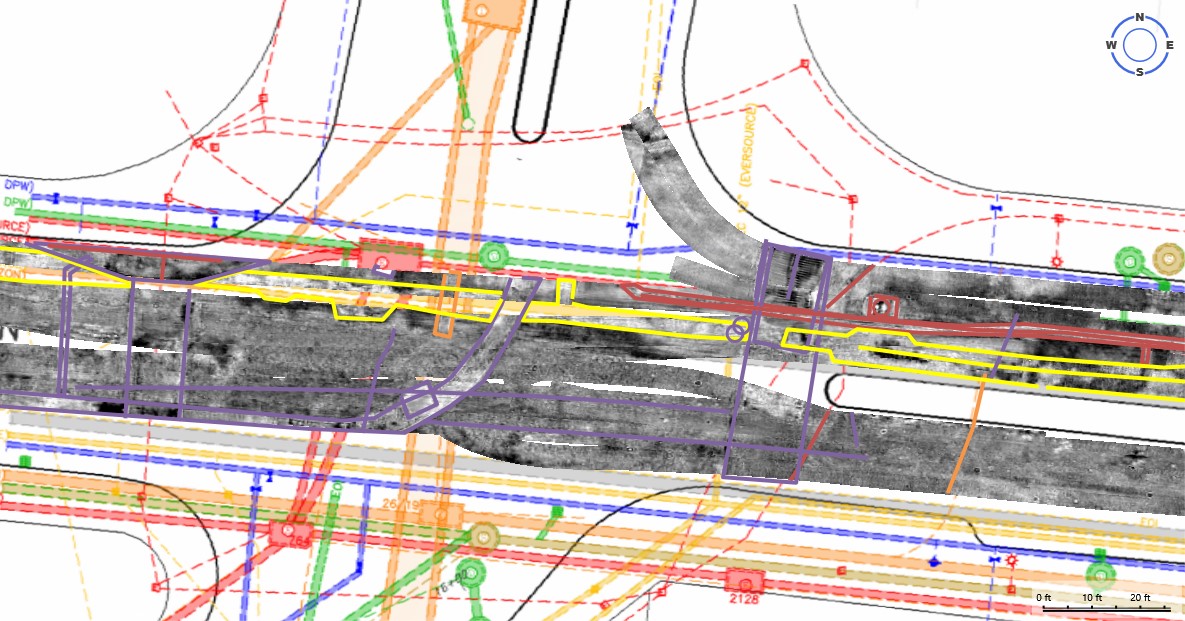
Radar tomography combines large arrays of GPR antennas, all working in unison to scan large areas very quickly. Unique post-processing software quickly stitches the GPR scans into a composite image for plan and profile viewing and interpretation. Essentially, given the number of antennas and the range of frequencies used, radar tomography captures more and better data than traditional, smaller pushcart GPR systems, giving utility surveyors the information they need to deliver to their customers the best underground mapping content possible. Likely customers for these types of professional services include utility asset owners such as telecom and energy companies planning for utility upgrades, transportation agencies looking to map underground facilities and voids, AEC designers, large-property owners mapping greenfield or brownfield sites, and cities and towns looking to augment their GIS with precise underground details for managing their infrastructure.
Creating Strong Content With Radar Tomography Systems
Some surveyors, mappers, and GPR professionals may think, “I already use all of those tools. What’s the big deal?” Indeed, a common myth when it comes to radar tomography is that it’s just a faster, bigger version of a pushcart. But simply applying GPR technology in a system does not automatically mean you’re using the radar tomography method.
Radar tomography combines numerous GPR frequencies, utilizing stepped, high-frequency antennas to collect more data than a pushcart can. The result is a clearer image of the underground with more detail using precise positioning of the data— essentially the equivalent of looking at a landscape through binoculars instead of glasses.
As an example, utilizing radar tomography in our work has led to us finding numerous undocumented telecom systems, abandoned facilities, underground vaults and tunnels, all in busy streets without accurate legacy data in their records. These undocumented facilities are one of the leading causes of project delays, project overruns and escalating project budgets. Imagine if construction crews weren’t aware of a large percentage of the underground prior to breaking ground?
In addition to being more efficient, radar tomography is the ultimate crisis prevention method when it comes to underground utilities, not just for the public’s sake, but also for the crews. The systems that we’ve used are mobile remote sensing systems that we can tow behind a van, keeping crews safe in a survey vehicle rather than in harm’s way on the street using push cart GPR sensors. In one pass of a street, we’re able to collect in minutes what it would take a day’s work to collect with push carts. Additionally, most of the towed GPR array is performed without temporary or full lane closures and has little or no impact on pedestrian and vehicle travel patterns, also reducing gour carbon footprint.
At DGT Associates, we’ve calculated our radar tomography jobs to be about 10x the efficiency of traditional underground data collection methods.
Leveling Up in Quality
As with any good content, once you have the utility information, the next step is to analyze and translate it. By utilizing data gathered from radar tomography coupled with the data gathered from traditional SUM deliverables (EMI, pushcart GPR and vacuum excavation) we’re able to create a superior end product—the underground map that asset owners and other collaborators can confidently build on.
According to the American Society of Civil Engineers, the four utility quality level attributes typically used in civil engineering work range from quality level A (actually exposing and measuring the assets) to quality level D (simply relying on records). Quality Levels B and C are where most asset owners hover, but the two are vastly different. For Level C data, the correlation between asset owners’ records and surveyed surface utility structures usually suffices. While this is common for ALTA, site surveys, and traditional existing-condition surveys, it does not include any underground verification.
For data to be designated as Quality Level B, highly skilled utility surveyors, land surveyors, and geophysicists must verify exactly what the underground items are and annotate size, depth, and other critical information that depicts a comprehensive and accurate representation of the utilities and infrastructure. This is where radar tomography shines.
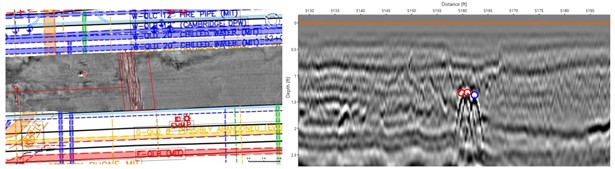
“It’s one thing to know where a pipe is on a bird’s-eye view 2D map. It’s another thing to see it in 3D and know precisely the depth location of the pipe, its circumference, and whether it’s hollow or solid. Most GPR data will get you the former, but radar tomography will enable the latter,” said Mitch Liddell, PhD and lead geophysicist at DGT Associates. “You could liken it to the medical world; a more detailed x-ray enables your doctor to better see and interpret what’s happening inside your body.”
Because sophisticated radar tomography systems enable a more fruitful “picking process,” professionals like Mitch can stand confident in their Quality Level B deliverables, confirm the locating information from the other complementary locating systems, and so that asset owners can have more accurate, up-to-date information on the utilities.
For Continuing Success, Collaboration Is Key
In recent years the growth, subsurface utility mapping has engaged numerous GPR manufacturers to focus on building new, improved and more robust wide-array GPR antennas. But the reality is this: there are only a handful of radar tomography systems in the world that are equipped with the technology capable of acquiring the level of data necessary to render such detailed underground utility maps.
In order to reduce underground utility damage events, everyone in the industry has to work together and use the best and most appropriate technology in the market to map the underground. While not every utility locating team will want to purchase, invest, hire and train a team for radar tomography services, collaboration is essential. That means competitors can become partners and Davids can join in with Goliaths. By forging partnerships with others in the industry to increase the use of radar tomography, we can provide everyone, from asset owners to architects to construction crews, with the content they need to minimize risk and run successful underground utility mapping projects that are completed on time and on budget.