Project Spotlight: Mapping Layers of Utility History Underground in Charlestown’s City Square
Project Spotlight: Mapping Layers of Utility History Underground in Charlestown’s City Square


Today, City Square in Boston’s Charlestown neighborhood is a key gateway in and out of the city. While many residents currently see the shiny, new mixed-use glass towers and the Rutherford Ave Bridge under construction, the area is much different today compared to its beginnings as a saltwater mudflat a few hundred years ago. Boston is a city with an ever-changing landscape, but the changes between North Station and City Square are unique in one way — a complex, multilayered web of underground utilities and old infrastructure. DGT Associates was contracted in 2019 by a major regional utility owner to survey the streets, bridges and tunnels and to decipher and depict the web below ground in preparation for new facilities. It’s been a multi-phase process involving meticulous archive research, advanced data acquisition and masterful geophysics. As one of our most robust subsurface utility mapping projects to date, the results have been a comprehensive survey above and below ground with minimal disruption to the surrounding community.
The Underground History of City Square
In the early 1700s, City Square and the area surrounding Charlestown were mostly underwater with a few saltwater mudflats. But as the city grew, Boston’s growing population took full advantage of the great harbor location, and the coastal areas of the city were filled in and converted to harborfront commercial properties. In the 300 years since, the area (also known as North Station for its regional commuter rail terminal) has changed dramatically several times leading to extremely complex infrastructure below ground.
For example, the area was once a portal of a vast railroad yard complex that stretched one mile west to the Museum of Science just outside of Boston’s Back Bay and half a mile north toward the Lechmere area in Cambridge. In the mid-1800s, numerous bridge crossings were constructed to connect Boston with the north side of the Charles River. Many bridges and streets were not only congested with pedestrians, horses and wagons but also horse-drawn streetcars, creating a complex network of public transportation and, in some instances, utilities.
In 1900 the North Washington Street Bridge, also known as the Charlestown Bridge, was constructed, adjacent to the Warren Street Bridge adding another layer of complexity to the underground. And while the old North Washington Street Bridge served the city well for over 100 years, the salty air and exposed location caused it to fall into disrepair. Despite best efforts to extend its useful life, the City of Boston and the Massachusetts Department of Transportation had to demolish the old bridge, leading to today’s construction on the North Washington Street Bridge Replacement Project — a new iconic landmark that is more pedestrian-friendly and scenic than any of its predecessors, referred to by the agencies as “a new bridge for the 21st century.”


The last big project that affected the City Square area and our work in that location was The Big Dig. In the decades-long project, the old highway flyover system was demolished and new underground highways and ramp systems pushed the noise and congestion underground. Out of sight, out of mind.
Until now.
All of this work and reconstruction has left a lot of ambiguity regarding the underground—affecting asset owners in the area, including our client. Many of the old bridges and ramps carried utility networks, and in each reconstruction project vast amounts of utilities had to be rebuilt or relocated, while some have been protected in place. Led by international SUM expert and DGT Project Director for Subsurface Mapping, Michael A. Twohig, our team has been tackling this challenge of how to map above and below ground in an environment that has seen so much change.
Phase 1: Building a library of historical documents
Locating and mapping the underground infrastructure network in North Station and the City Square neighborhoods was a daunting challenge. To build a picture of the below ground existing site conditions, it was important to first thoroughly research the entire area utilizing historical maps and atlases to understand each iteration of the area’s past.
Our work to overlay each map revealed the transformations of the landscape through the years, and, in some instances, showed entire networks of streets, bridges and utilities that were completely removed. At one time there was an elevated railroad as well as street-level tram tracks on Rutherford Ave with a large train station in the middle of City Square. The square also previously had numerous majestic masonry structures around it, but in the early 1900s, these were all removed and torn down. City maps revealed to us that the construction of the Mystic Tobin Bridge erected an enormous, elevated flyover through the square, which was subsequently knocked down in the 1990s to make way for the CANA (Central Artery North Area) ramps and highway connectors that we know today. Plans, reports and photographs document a landscape torn apart by infrastructure reconstruction.
It’s important with any subsurface mapping project to start with historical data to reassemble the timeline of utility changes, as applying the latest technologies alone will not uncover all the hidden secrets from past designers and constructors.
In addition to historical research, DGT also solicited all the asset owners in the region to collect the available data to complete the picture of the existing pipe networks. However, knowing that each generation of digital mapping has lost key details for buried networks, DGT also dove into our own 144-year-old archives to fill in the missing gaps. The DGT private digital archive hosts thousands of files that are no longer publicly available and serve as an invaluable resource for the DGT SUM team.


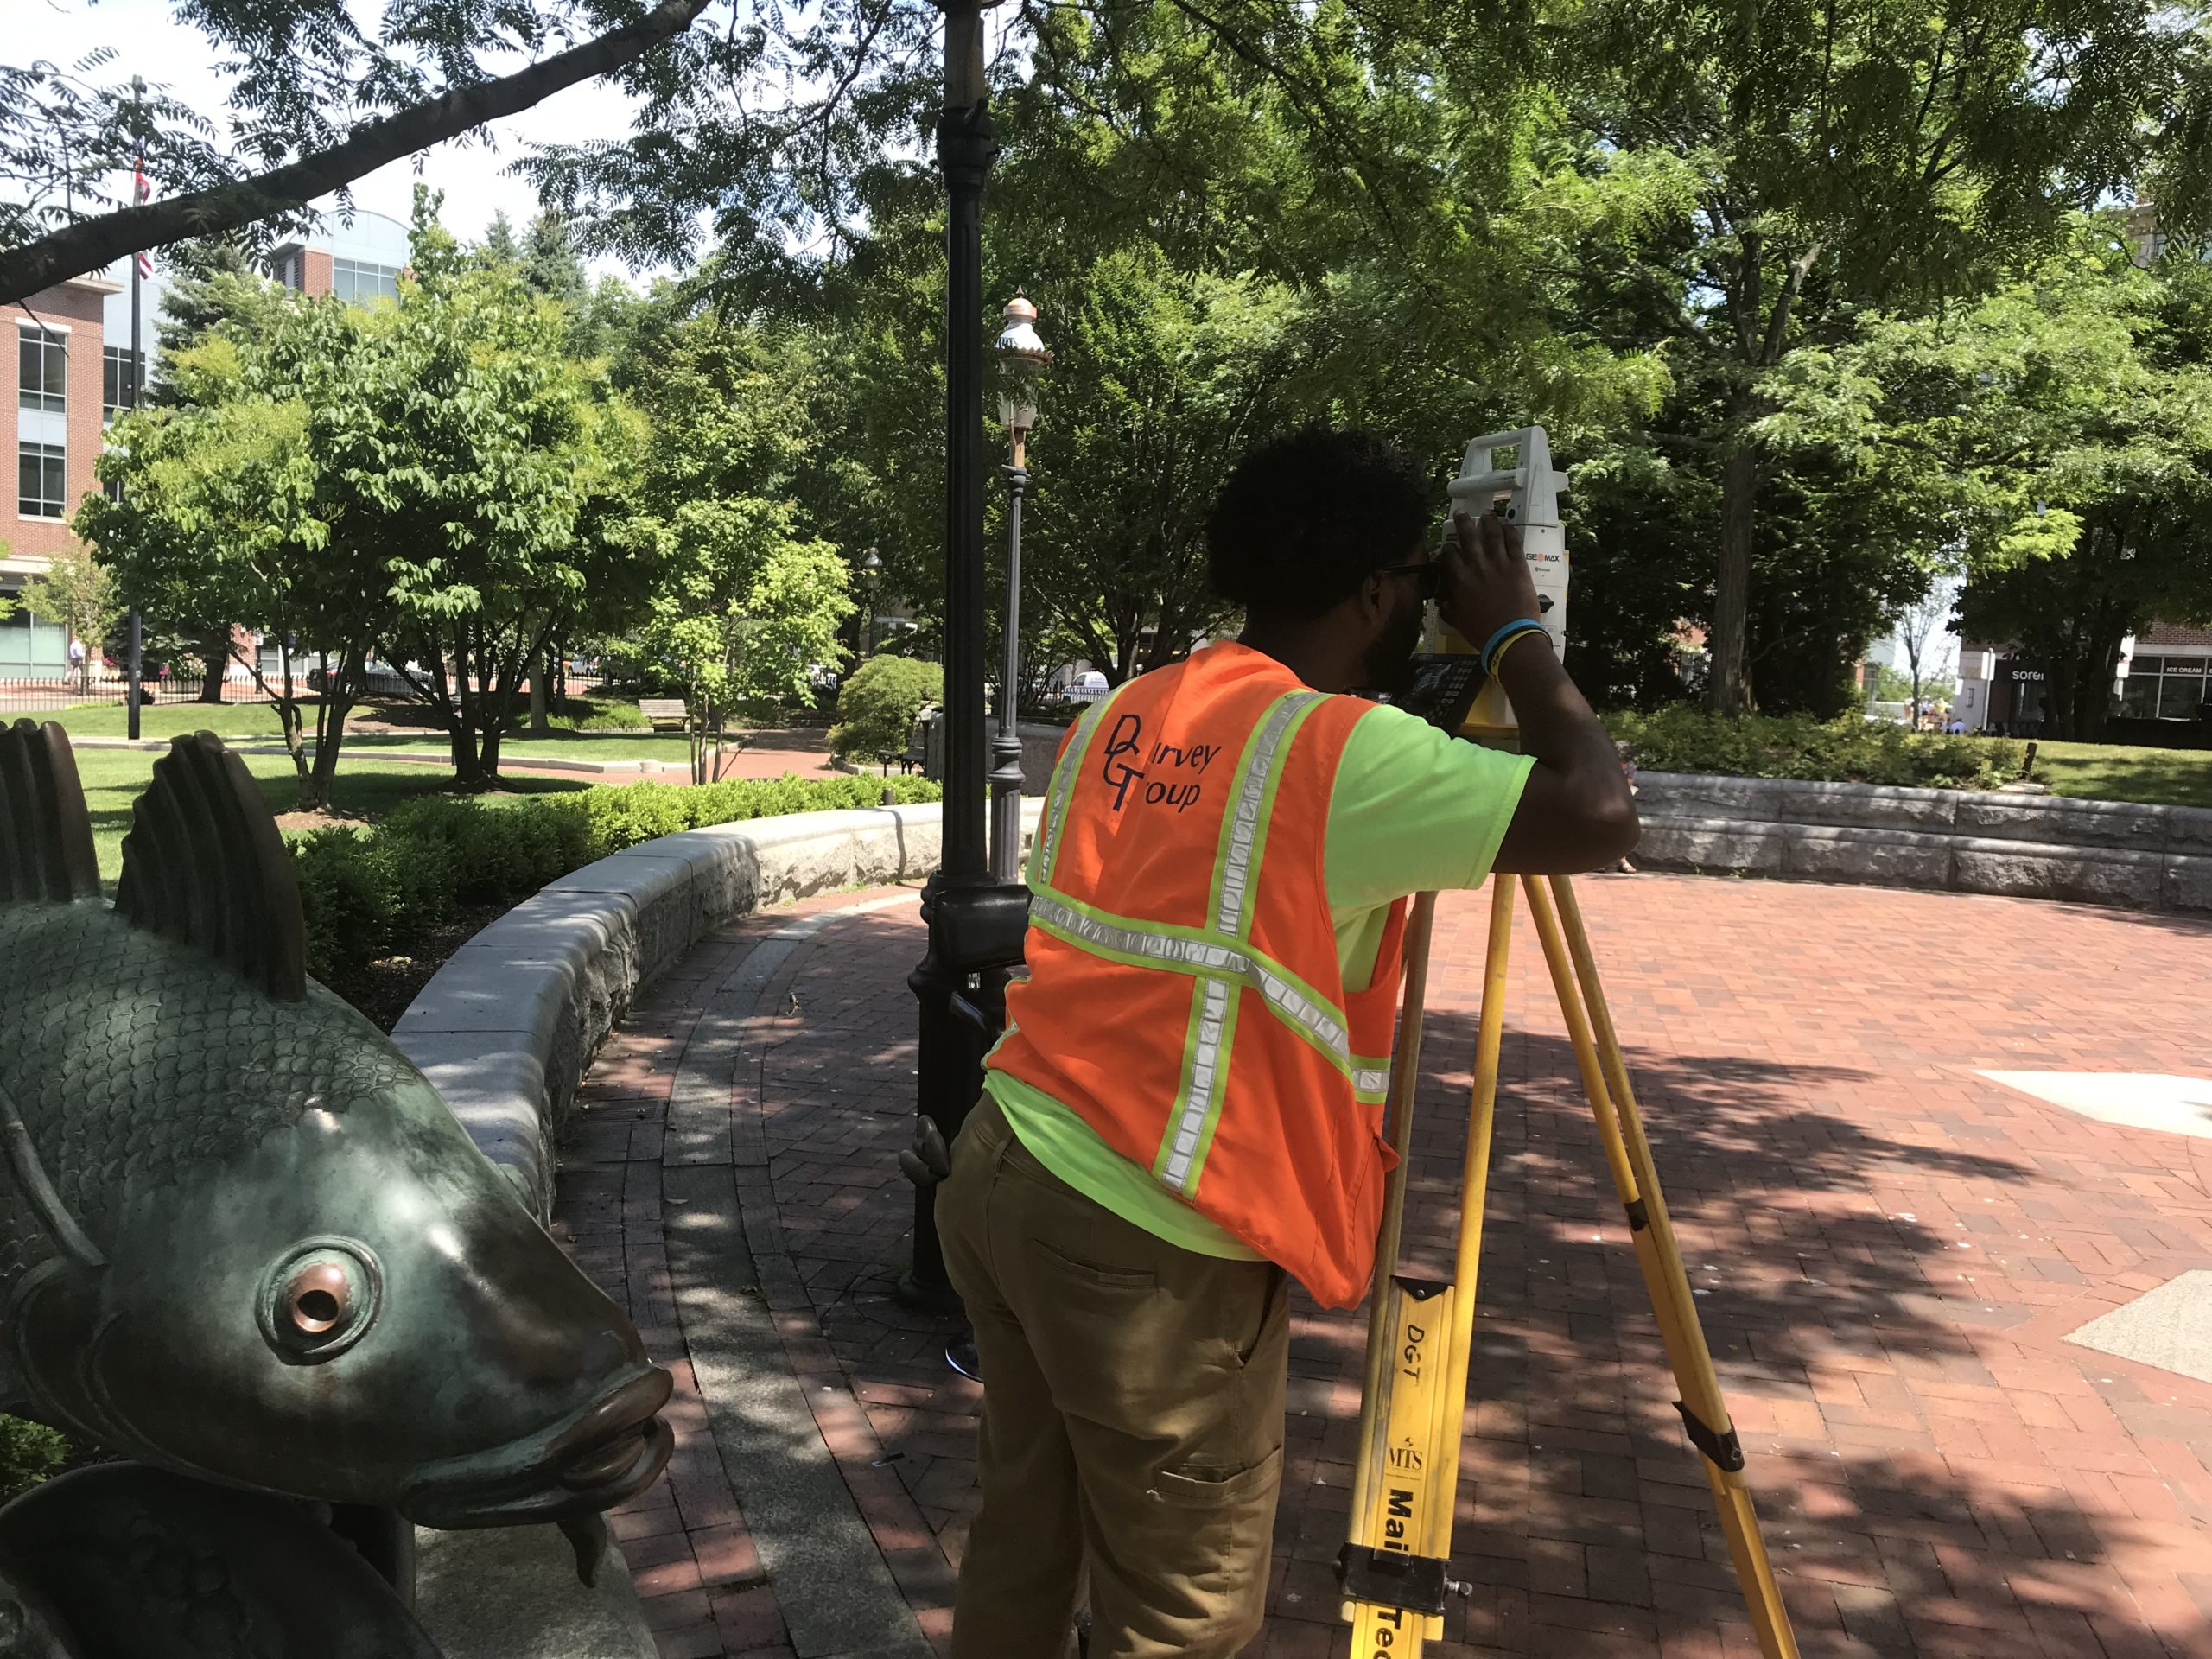
Phase 2: Surveying the existing site
Armed with the historical survey information, DGT moved to the next phase — capturing a current survey. We began with establishing a project Survey Control Network and utilized aerial photogrammetry to fly over and map the area. Subsequently, the DGT team engaged our geospatial partner to assist with a mobile LiDAR mapping program to map the above ground streets to layer onto the final map, but also the highway tunnel networks. We chose mobile LiDAR for its easy integration with the project control network and its lightweight footprint. We mapped the entire site in a single day without traffic control measures, any impact on pedestrians or vehicular traffic or impedance to ongoing construction activities.
The aerial and mobile surveys were then augmented with traditional topographic surveys. Combined they provided exact detail of the project area from the North Station region across the old bridge through City Square, encompassing the ramps and streets in the vicinity.
This aboveground survey gave us the street foundation for the final map which more importantly defined the area for the subsurface investigation.
Phase 3: Locating & mapping the subsurface environment
Initially the DGT teams began compiling the underground utility information to conform to ASCE 38-02 Quality Levels C and D. While most utilities are pretty straightforward to map, as anticipated, many paved-over and abandoned streets and structures appeared in the historical documents. We had to decipher: what is real and what is gone?
Many professionals choose not to show abandoned and discarded systems. But at DGT, we always advise clients toward higher quality level data; there is always a risk and cost associated with forsaking this effort. For example, old waters, sewer, drain and gas lines may still contain fluids and gases that could expose construction workers to risks, exposures or environmental spills during excavation efforts. Including this Quality Level D information on design documents enables the design team and contractors to make informed decisions on site and engage the various asset owners in the planning stages of a project if and when removal of these old systems is required.
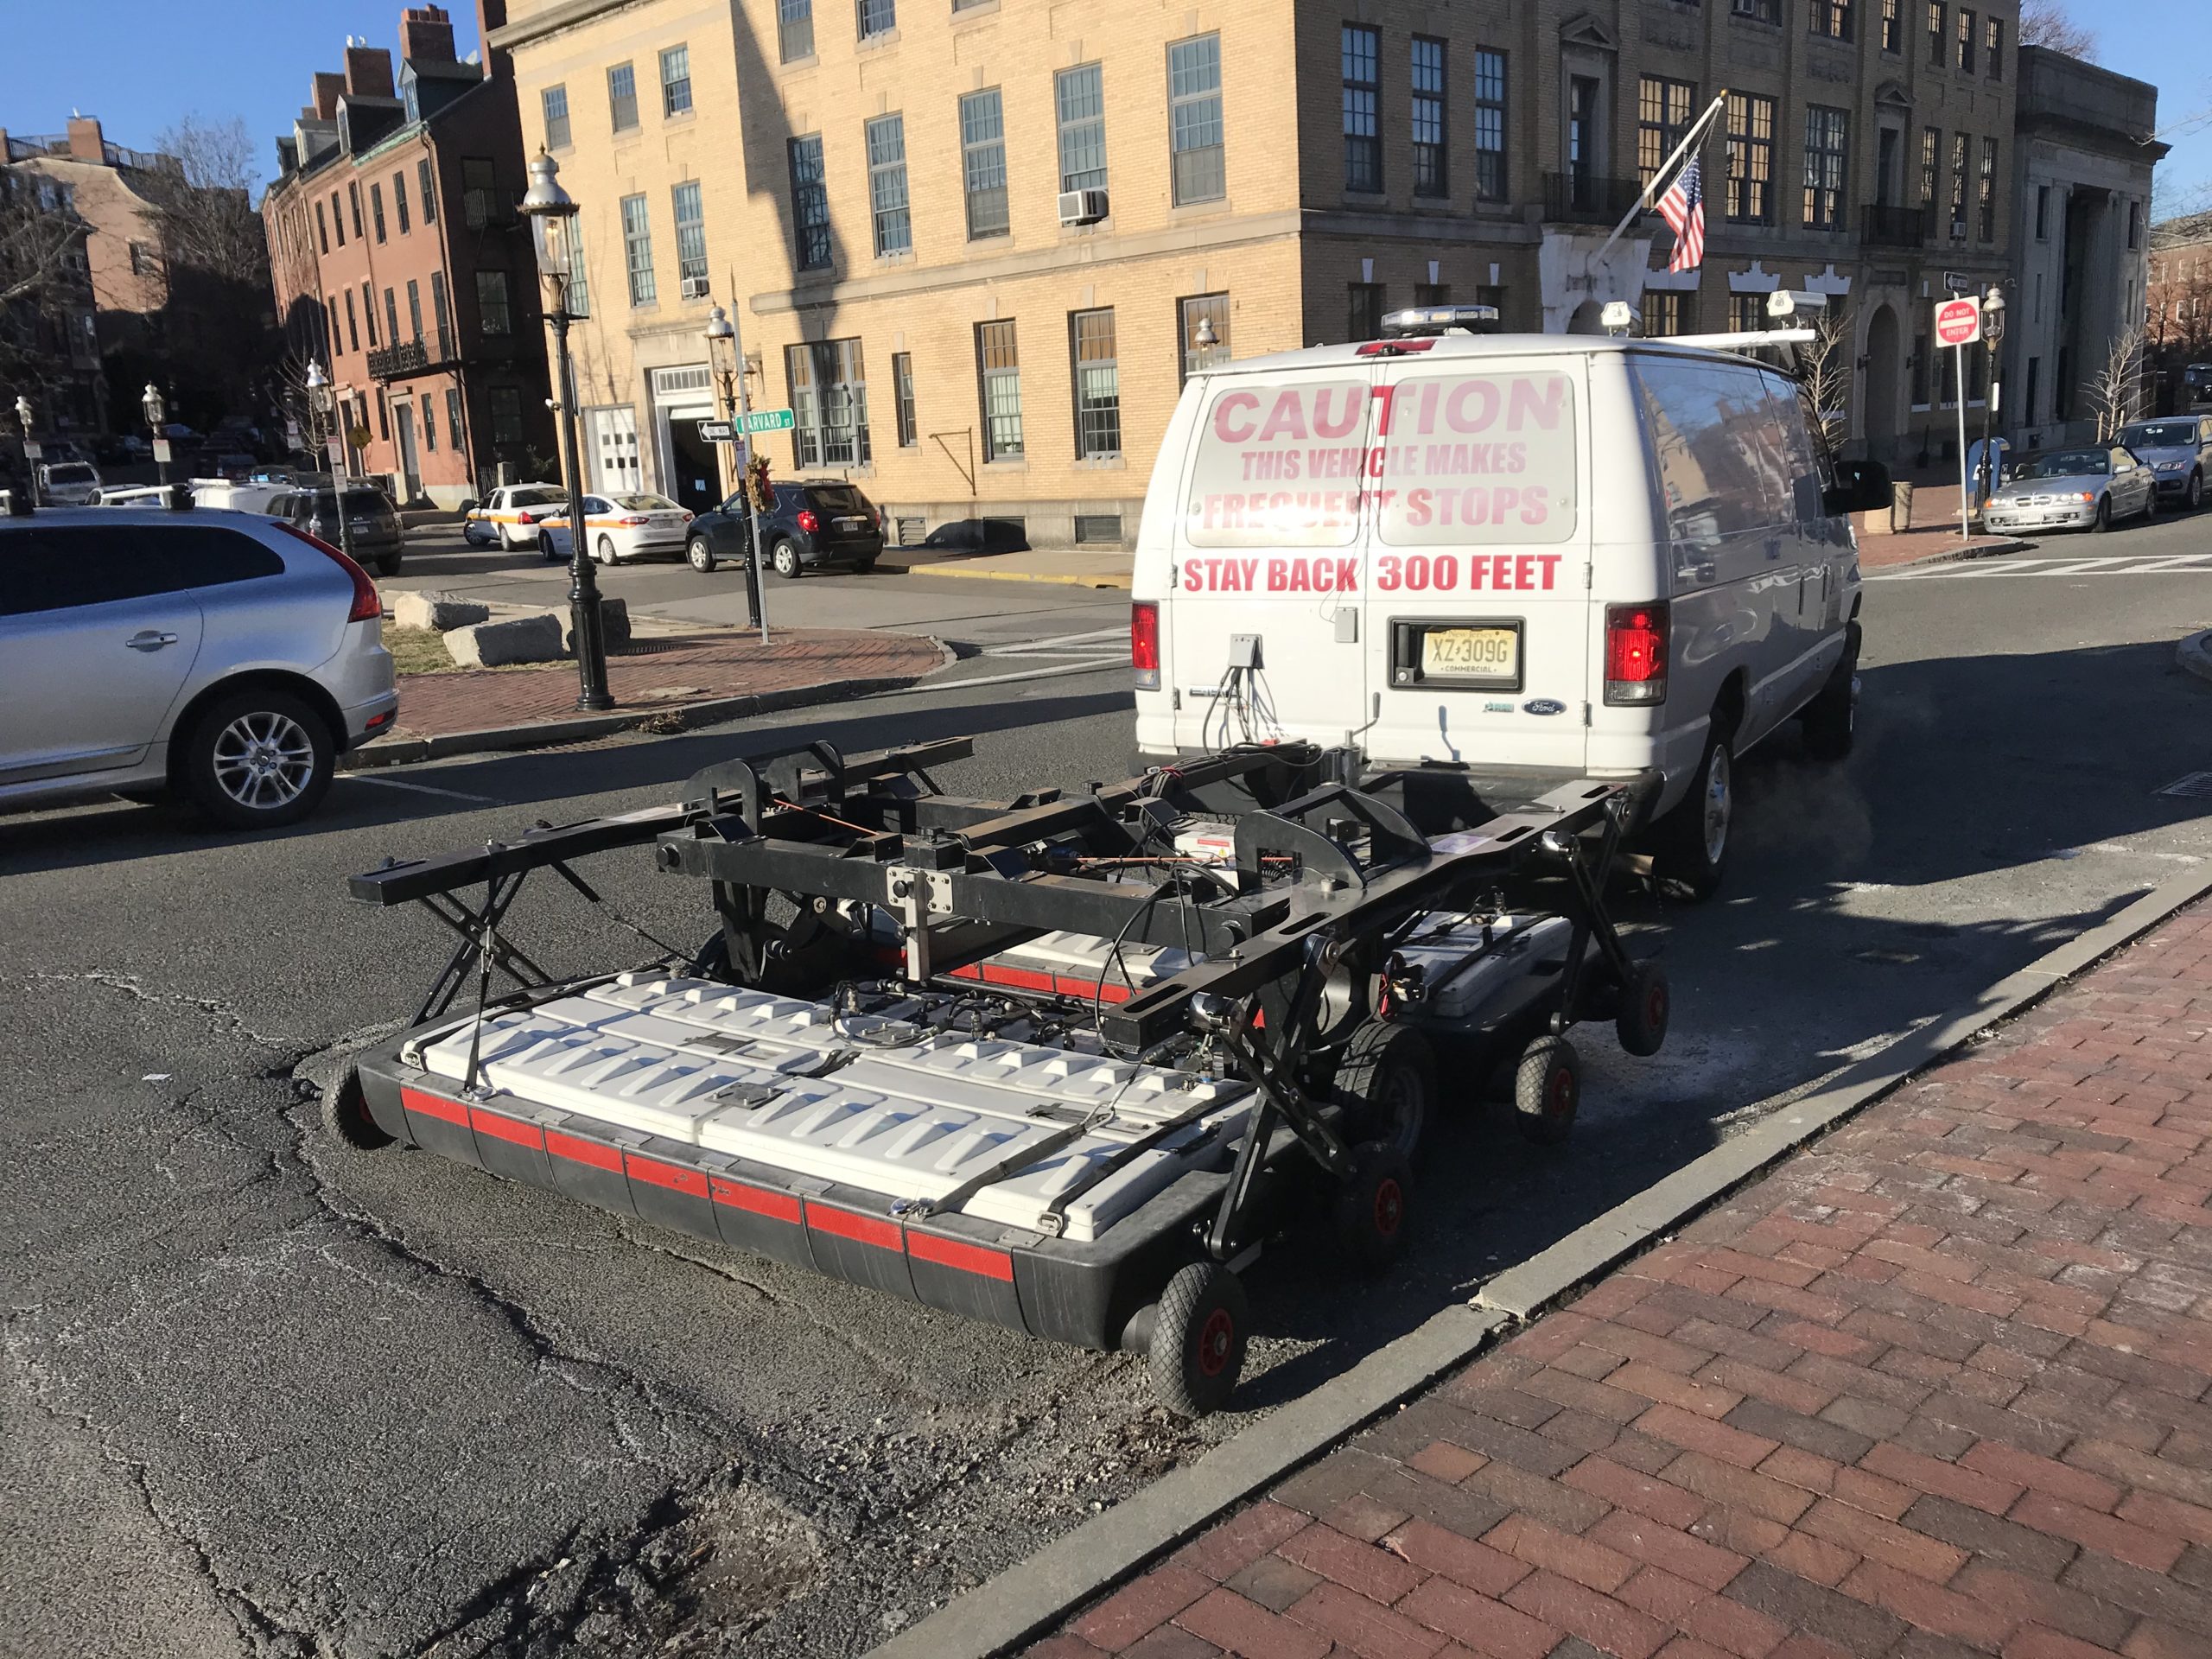
Next, DGT began tracing the existing utilities using EMI and Pushcart GPR systems. Although this traditional method of using hand-held utility locating worked well in most areas, the multiple traffic detours and lanes closures for the bridge construction and demolition prohibited us from occupying some congested travel lanes. Additionally, the project scope was unique in that the final digital file required a 2D and a 3D CAD model for the designers. Capturing the location of the utilities using our geophysical instruments was not enough; captures of accurate depth information were also required and the field data capture services required extra attention to detail.
To meet these challenges, DGT deployed another even more effective mobile mapping platform — radar tomography — to acquire the needed 3D information without impacting traffic and pedestrians. Using radar tomography, we identified numerous underground anomalies that did not appear on any source documents or detected with the handheld devices. In addition, numerous data point extractions provided confirmation of the traditional utility locating devices and radar tomography also provided some valuable estimated depths of features.
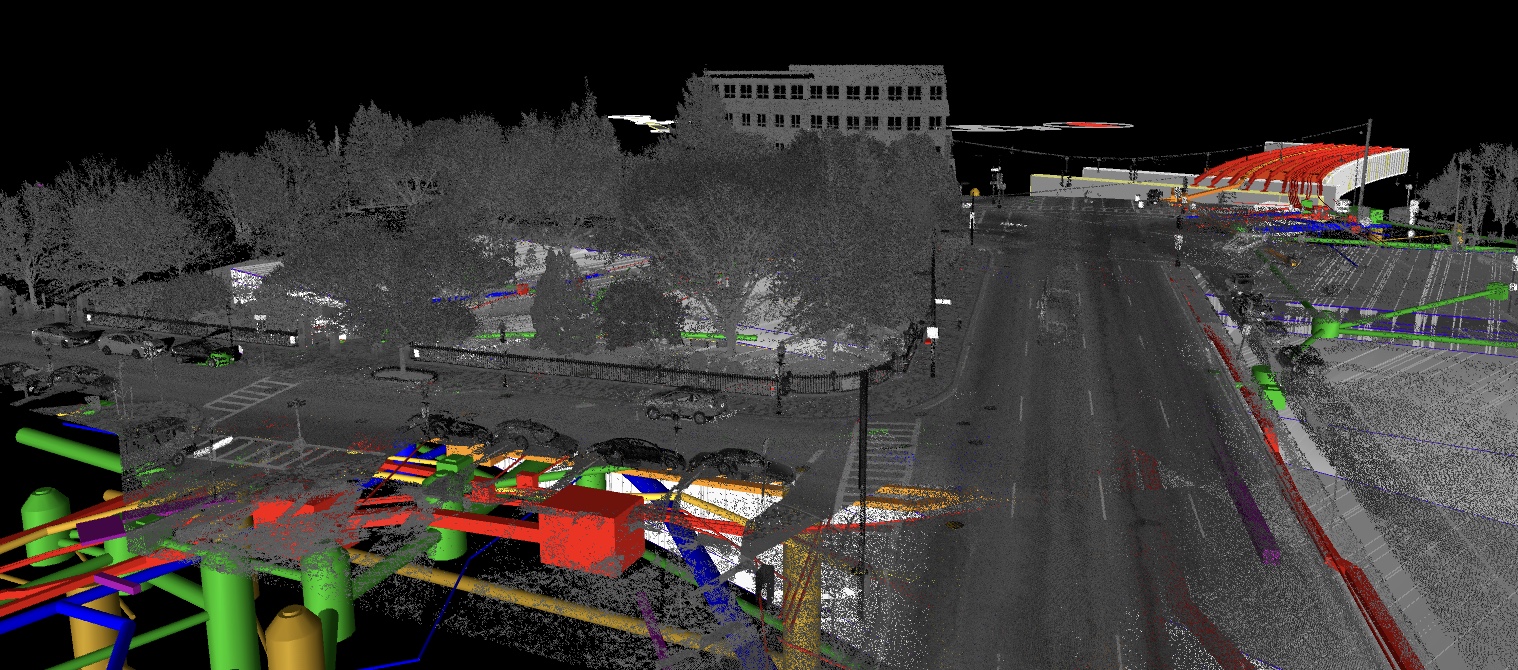
Phase 4: Creating the Subsurface Information Model (SIM) & Digital Twin
Building a digital representation for most civil design projects begins with a simple CAD file. For this project, DGT built a typical project file in AutoCAD incorporating data from the DGT legacy CAD files for the area and our aerial photogrammetry and topographic field mapping. The radar tomography and pushcart data were then integrated and reconciled with the historical utility data (including the ongoing bridge construction inside our project’s limits) into the 2D CAD format. With so many projects completed in the area over the past 200 years, there were thousands of documents in the project library. This information was completely correlated in detail by our geophysicist, and the result was a 2D composite utility data set conforming to ASCE 38-02 Quality Level C and D — a subsurface information model (SIM).
For the conclusion of the project, DGT provided a 2D and 3D model of the project for the client. While the cost of the delivery is more than a traditional SUM project, the cost savings and avoided accidents the utility company will experience over years of continued construction are already clear and valued by the client.
Project Takeaways for Any Asset Owner or Surveyor
The lessons learned from the City Square SUM project can be applied by any professional building in old cities like Boston:
- Years of construction without proper record upkeep creates more work later.
- Blending historical data with current data provides a more complete picture of the underground.
- Advanced technology like radar tomography not only keep crews and communities safe, but also collects precise 3D detail in less time.
- Data must be presented in a format that’s usable, storable, and digital.
- A well-thought-out, longer SUM project may appear to incur more upfront costs but will save project owners from unexpected, timely costs down the line. As they say, better safe than sorry.
While many utility surveyors get dispatched to a site and begin locating without thorough utility research through the centuries, DGT has a much different response. Armed with a complete composite of utility plans that represent an accurate picture of an underground, DGT takes a phased approach for the field technicians. This approach considers the risks to field crews, pedestrians and residents. But more importantly, it allows for us to decide the appropriate application of technologies that are best suited for a successful project.